Histograms, Frequency Polygons, and Ogives
Draw and label the x and y axes.
STEP 1
STEP 2
Choose a suitable scale for the frequencies or cumulative frequencies, and label it on the y axis.
STEP 3
Represent the class boundaries for the histogram or ogive, or the midpoint for the frequency polygon, on the x axis.
STEP 4
Plot the points and then draw the bars or lines.
Procedure

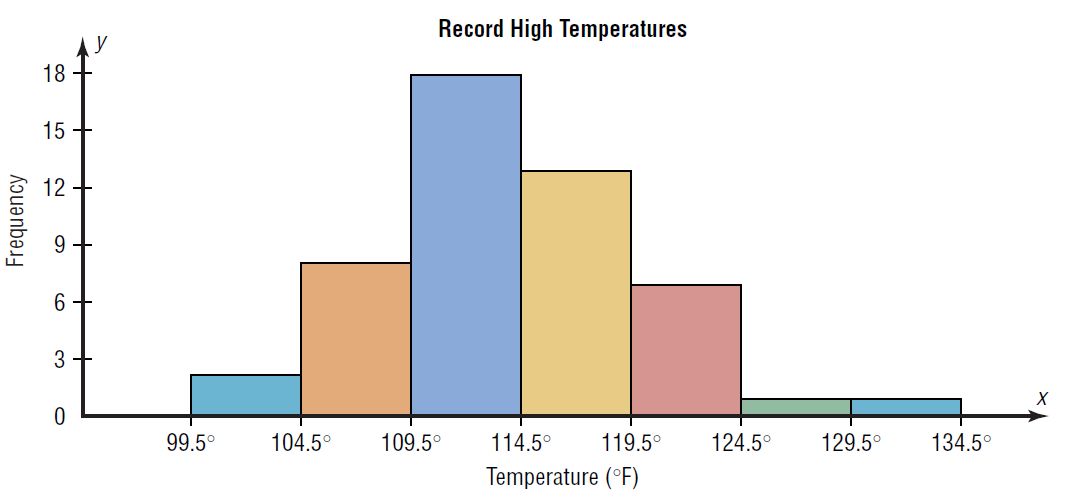
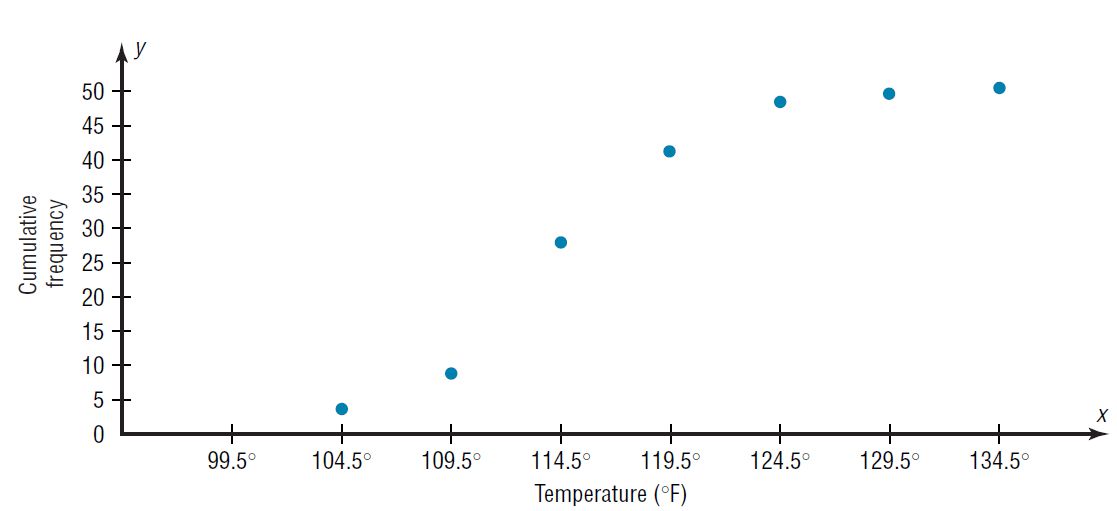
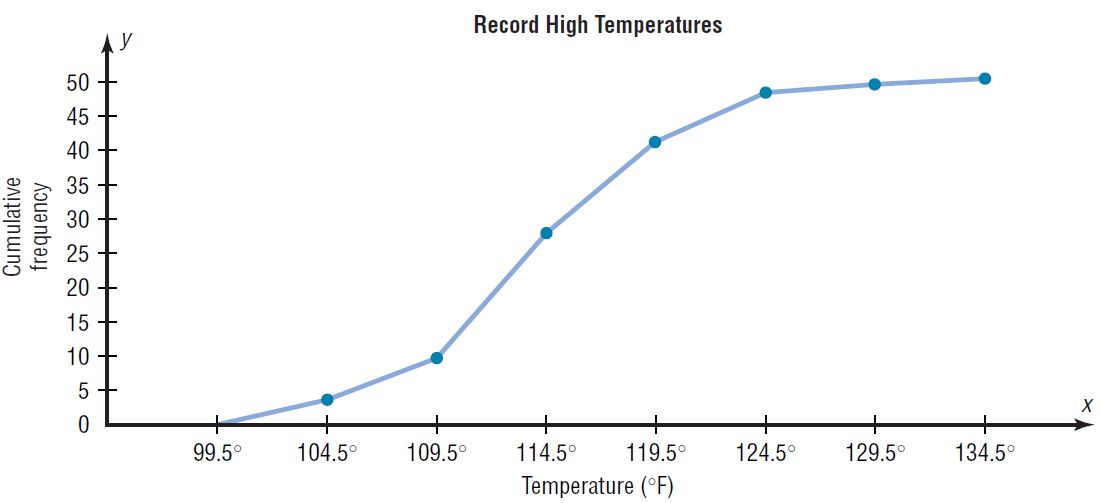
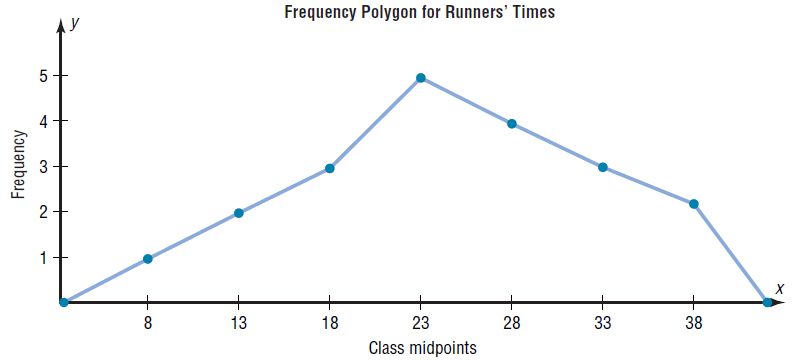
Construct a histogram, frequency polygon and ogive to represent the data shown for the record high temperatures for each of the 8 regions.
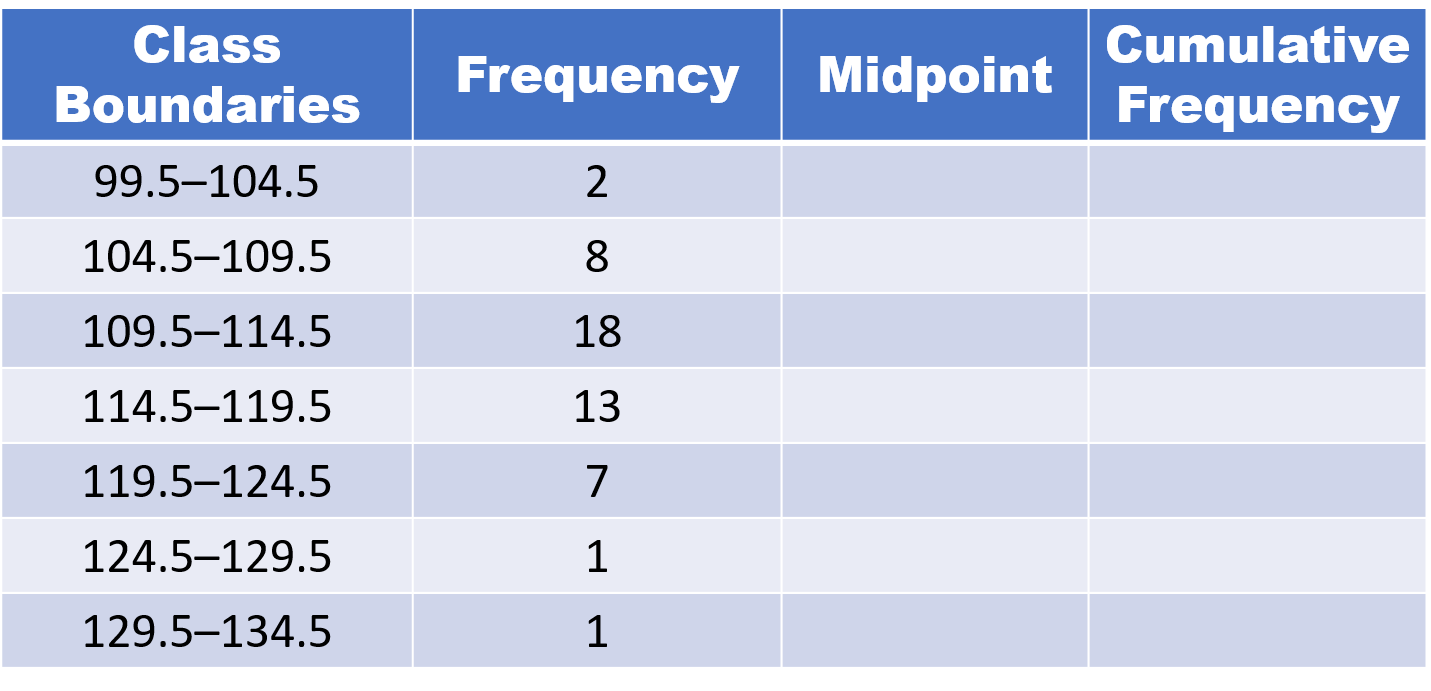
102
107
112
117
122
127
132
2
10
28
41
48
49
50
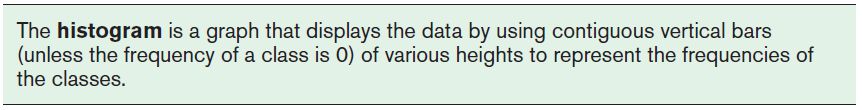
HISTOGRAM
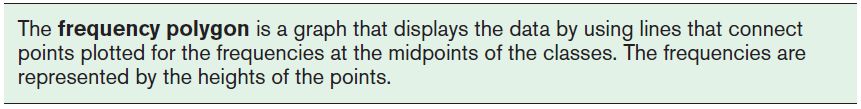
FREQUENCY POLYGON
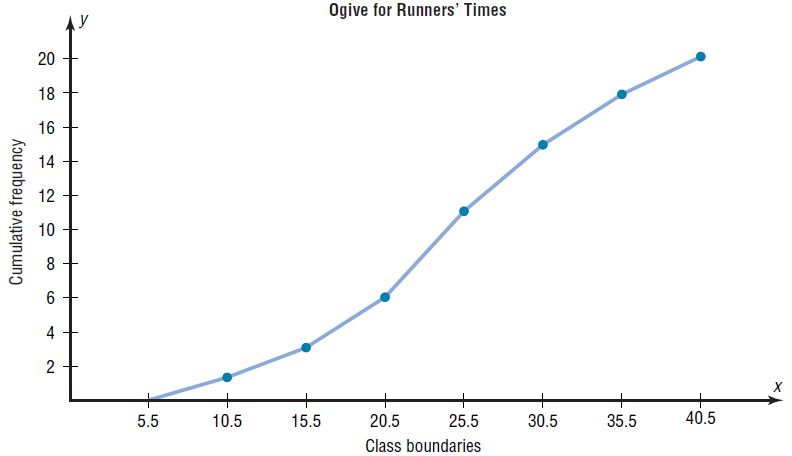
O G I V E